Subscriber Trace Log
subscriber, tracer, trace, log, starting rule, wait condition, subscriber
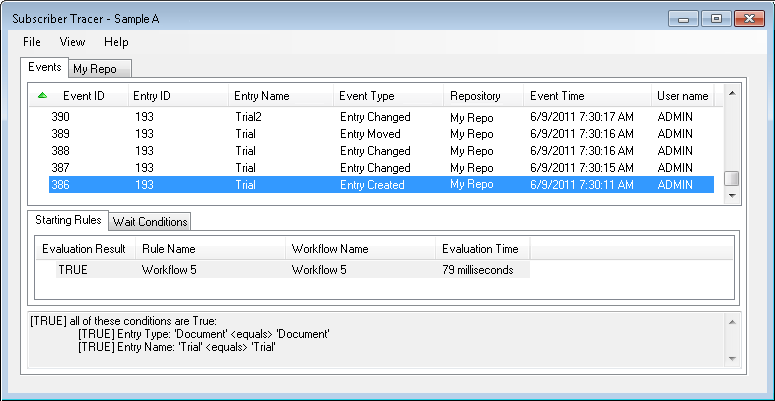
The Subscriber Trace Log, accessed from the Subscribers node (under the Monitoring node) of the Workflow Administration Console, shows events that occurred in the monitored repositories and whether a starting rule or wait condition was evaluated for each event in the repository. The Subscriber Trace log can be very helpful when troubleshooting or debugging your workflows.
Tip: The Subscriber Trace Log rolls over every 1000 events. Workflow archives rolled-over log files in the Workflow server file system location. The default folder is C:\ProgramData\Laserfiche\WF\ServerData\SubscriberLogs. Archived log files are stored as zipped XML files. From the Subscriber Trace Log viewer, you can use the File menu to open the XML log files.
![]() Show me what this dialog box looks like.
Show me what this dialog box looks like.
![]() See a video about the Subscriber Trace Log.
See a video about the Subscriber Trace Log.
To open the Subscriber Trace Log
- Open the Workflow Administration Console, and, in the Console Pane, expand the Monitoring node.
- Select Subscribers. The node will list of all the Workflow Subscribers.
- Select a subscriber, and click Show Subscriber Trace Log below the subscriber name in the Actions Pane. Alternatively, right-click a subscriber and select Show Subscriber Trace Log.
To view starting rule evaluations
- To see how, or if, a starting rule was evaluated for an event, select an event in the Events tab.
- If any of your starting rules are configured to run on the same Event Type as the event you selected, the Starting Rules tab will display how the rules were evaluated. The Starting Rules tab shows the Evaluation Result, Rule Name, Workflow Name, and Evaluation Time.
- You can view the complete evaluation of each aspect of the starting rule in the gray Condition Trace box below the Starting Rules tab.
Example: You have a starting rule named "Copy and Approve" that runs when an entry is copied and its Status field is set to approved. If the event you selected in the Events tab was an Entry Copy event, then the "Copy and Approve" rule's evaluation would show in the Starting Rule tab. If an entry was copied but the Status field was not set to Approved, the rule would be evaluated as false. If the entry was copied and the Status field was set to Approved, the rule would be evaluated as true.
Note: To hide the Condition Trace, select View from the main menu and clear Show Condition Trace.
To view wait condition evaluations
- To see how, or if, a wait condition was satisfied by an event, select an event in the Events tab.
- If any wait condition can be satisfied by same Event Type of as the event you selected, the Wait Conditions tab will display if the wait condition was satisfied, the activity name, the instance ID number, the evaluation time, the thread ID, and the Sequence Number.
- You can view the complete evaluation of each aspect of the wait condition in the gray Condition Trace box below the Wait Conditions tab.
Example: You have a wait condition that is satisfied by a document's name changing, which is an Entry Changed event. If a document is moved, the wait condition will not be evaluated. If a document has a field assigned to it, the wait condition will be evaluated as false because, although adding a field is an Entry Changed event, the document was not renamed.
Note: To hide the Condition Trace, select View from the main menu and clear Show Condition Trace.
To view additional data about the events in a repository
- The Subscriber Tracer will show a tab for each repository the subscriber is monitoring.
- Click a repository's tab to see
 additional information about events occurring in the repository.
 - The tab displays Processing Loads charts, the Subscriber Data, the Notification Data, the Evaluation Data, the number and size of Message Queue Messages, and an Events Processed Chart.
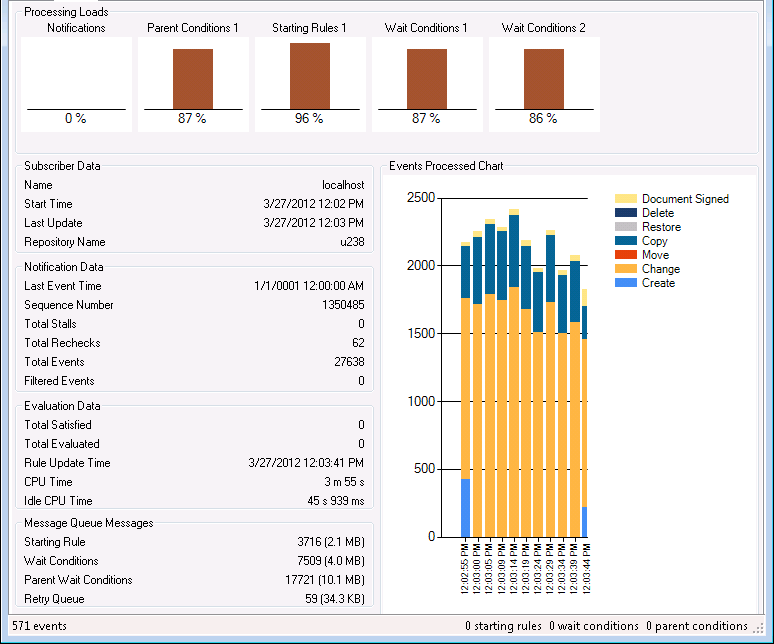
Note: The screenshot revealed by clicking additional information in step 2 shows a Subscriber under high load.
To search for events
- Select View from the main menu.
- Select Show Filter.
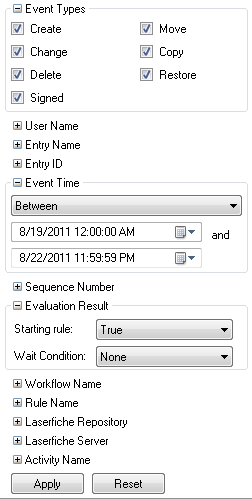
- This pane allows you to search by Event Types, User Name, Entry Name, Entry ID, Event Time, Sequence Number, Evaluation Result, Workflow Name, Rule Name, Laserfiche Repository, Laserfiche Server, and Activity Name. Expand and configure the desired search types.
- Click Apply to search.
- Optional: Click Reset to revert to the default configuration.
Tip: The status bar at the bottom of the Subscriber Tracer window shows, on the left, the number of events found and the number of events hidden by the filter (filtered). On the right, it shows the number of starting rules, wait conditions, and parent conditions (conditions that use a parent entry such as parent name, parent path, parent folder/document count, and parent folder contents) and, in parentheses, the average amount of time it took for each of these types of conditions to be evaluated.
To refresh the Subscriber Trace Log
To refresh the Subscriber Trace Log to view current changes to your monitored repositories and current condition evaluations, you can:
- Click View in the main Subscriber Trace Log menu, and select Refresh.
- Use the keyboard shortcut F5.
- Right-click the event list section, starting rules list section, or wait conditions list section, and select Refresh.
To save a trace log
- Select File from the main menu.
- Select Save As.
- Browse to where you want to save the trace log.
- Click Save
- The log will be saved as an .xml file.
To open a trace log
- Select File from the main menu.
- Select Open.
- Browse to the .xml trace log you want to open.
- Click Open.